My 1.5-year-long experience with the ketogenic diet, plus research on the health implications.
Disclaimer
I'm not formally trained in medicine, nutrition, physiology, etc. I don't claim adequate subject-matter knowledge, nor do I blindly recommend this diet for others. I also don't have anything to sell. I simply explain why I tried the diet and my experience sticking to it for the past 1.5 years, in addition to sharing some resources that inspired me to try it out and research I've found on PubMed and related sources.
Background
As a kid, my parents worked long hours and weren't particularly wealthy. I wasn't physically active (minus flailing around during my K-8's basketball team practices) and stayed with my paternal grandparents after school until my parents could pick me up at night. That often meant eating foods like frozen pancakes/waffles and boxed cereals in the mornings, quick and easy thermos meals like alfredo pastas and stir-fried noodles for lunch, and Vietnamese staples like Bún bò Huế and Bún chả that my grandmother prepared for dinner. This combination of factors most likely made me overweight as a child, e.g., me at around age 12:

I did end up slimming down quite quickly when I entered high school, possibly due to starting (and absolutely sucking at) cross-country, better food as my mom had more time to learn and cook homemade meals, or simply because of a growth spurt. More specifically, after I had stopped getting taller, I was around 70 kg (or 155 lbs for the impaired). For reference, this was me at around age 14:

Regardless, even after I slimmed down, I struggled with staying lean, avoiding sweets, and, in general, not thinking about food. I would find myself gaining weight even if I indulged in the slightest bit more food, and couldn't stop myself from eating sweets once I had a bite. This was made readily apparent when COVID took over the world, and we were forced indoors. Despite starting to eat healthier (i.e., oatmeal instead of cereal, roasted veggies instead of pastas, etc.) and maintaining some sort of exercise via a push-up board, I quickly gained weight and sat at around 80 kg (175 lbs). This was me at around age 16:

By sheer coincidence, a family friend introduced me to indoor climbing at Movement SF (then named Planet Granite), where I quickly fell in love with the sport. After years of sucking at sports (i.e., baseball, basketball, cross country, taekwondo, golf (if you think it's a sport)) and being reminded about it by peers, coaches, and parents alike, I had not only found a sport I actually enjoyed, but a community that wanted to see each other succeed. I began going to the gym upwards of six times a week, while simultaneously getting more interested in cooking. Shortly thereafter, I returned to my original weight of 70 kg and sat there with relative ease:

Then, after fucking up college applications by forgetting to submit my enrollment payment to Worcester Polytechnic Institute (WPI), by chance (or not, depending on who you ask), I landed at the University of California, Merced (UCM) for a year. While I felt confident with living by myself, the two things I felt were especially awful about living there were 1) the food, and 2) the lack of climbing gyms. To stay sane, I cooked for myself and hang-boarding every day, plus "climbing-specific" exercises in the gym (i.e., wrist/finger curls, weighted pull-ups/isometric holds, etc.), only going to the nearest climbing gym named Alpine in Ripon on the weekends, which was an hour drive away.
I fell back on a diet I thought was healthy (and possibly is, just maybe not the way I did it): oatmeal with protein powder cooked with a pea protein milk for breakfast, and rice with sautéed chicken breasts and veggies for either lunch or dinner, whichever I felt like eating since I also decided intermittent fasting was something I wanted to try. Whenever that wasn't enough (which was often the case), I ate either dried fruits such as dates, figs, and persimmons, or "minimal ingredient" protein bars such as RX bars. Because I had just recently started identifying as a climber and wanted to maintain good shape, I persisted with maintaining this calorie intake and fought every urge to eat more with a passion.
As a result, I had lost quite a bit of weight, down to 64 kg (140 lbs). I was not satiated at the end of every meal, nor even close to satiety between meals. At the same time, I struggled to maintain my climbing grade, felt generally weaker, and sustained my first-ever major climbing injury: a pulley strain on my left middle finger that required months of rehab to get back in order. Whether that's due to diet, exercise, etc., is not certain, but it seemed at the very least related.

After transferring to Santa Clara University in my sophomore year, I moved back to live with my parents. While the diet was obviously more diverse and tasty (thanks Mom!), it was still the same diet, just with more allotted calories. I actually don't remember a turning point in the extra allotment, but rather felt the need to eat more once I moved back, possibly because I was able to start climbing regularly again, or just being in the presence of parents who want to see you eat more. I'd yet again returned to and maintained my original weight of 70 kg with relative ease:

However, I was still hungry all. the. fucking. time. The absolutely bonkers thing about it was that I felt satiated at the end of every meal, but no satiety. I distinctly remember eating breakfast at 7 a.m., driving to school, ending my first class at 10:20 a.m., and having to scarf down my lunch before my 10:30 a.m. class since I couldn't hold out till noon. Whenever I wasn't eating, I wished I were. To climb properly, I'd have to eat some fruit or packaged fig bars with plenty of sugar 1-2 hours before climbing.
Then, sometime around August of 2024, I came across a four-hour-long video titled The ketogenic diet in sport performance - 6 years of experiments and scientific evidence by Scottish rock climber Dave Macleod. In it, he claims within the first minute that the ketogenic diet is "highly useful for some ... athletes, some of the time", backing this claim with 150 scientific papers. That nuance was what caught my attention, since I had recently gotten sick of listening to ad-ridden and extremely confident podcast hosts such as Andrew Huberman and Joe Rogan (yes, I'm sorry I was a podcast boy).
Let me be very clear: I was extremely skeptical at first, especially with the emphasis on consuming more red meat and eggs, which I had been told by family members (even my cousin, a board-certified pediatric hematologist-oncologist) were sure to raise my cholesterol and cause problems down the line (more on this later). But given that I had no other option in mind to fight this lingering hunger, and the fact that any diet was probably unlikely to affect me in the long term even if I stuck with it for a year, I said fuck it and started doing it. As per recommendations made in this and other videos, I set out to eat around 5-8 eggs alongside some steak in the morning, more steak at lunch, then even more at dinner, allowing myself berries, peaches, and mangoes for sugar cravings. The amount of steak and fruits would vary based on my feelings of satiation and satiety.
My experience
I'll start with my subjective experience, then link to blood panels for concrete health evidence.
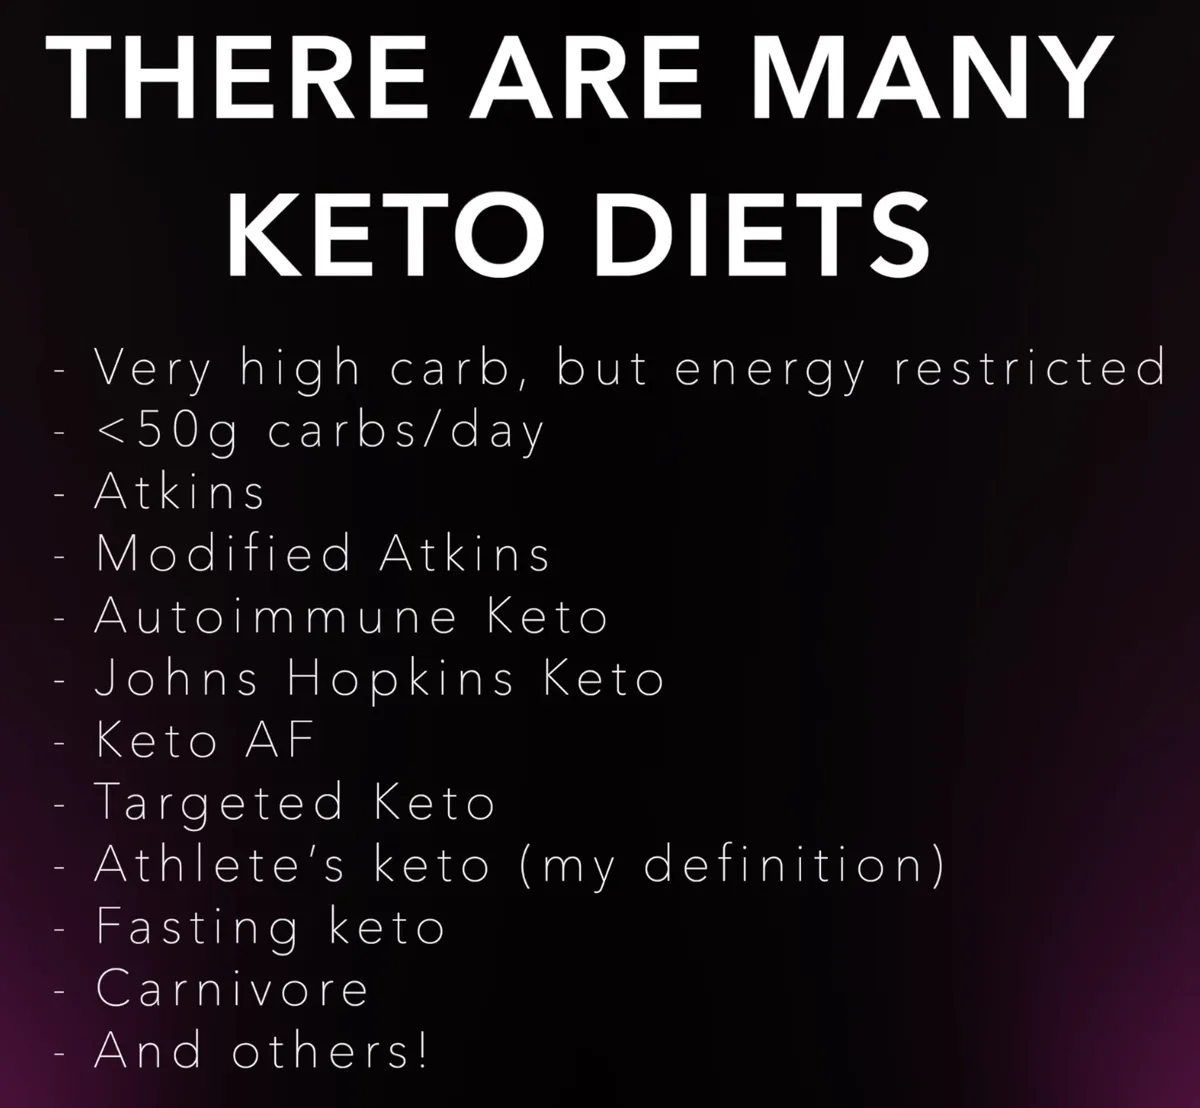
The diet described above was as close to Dave's definition of an "athlete's" keto diet as I could get. While he mentions others, he did not go into those with as much detail, so I chose to not push my curiosity any further.
I quickly found out that eating three meals a day was simply not possible. I literally couldn't eat that often as I didn't feel hungry to do so, which amazed me! And as it turned out, even eating steak in the morning with that amount of eggs was too much food, and I only really ate steak for dinner. I could go hours without even thinking about food, and I ate when I felt the need rather than counting down the hours for when I "should" eat. I also noticed the urge for sweets was satisfied by fruits when I sufficiently abstained from desserts. Whenever I indulged in desserts, I noticed that they were either much sweeter than before or very muted in flavor.
An important note I should mention is that the amount of fat to eat took a bit of time to get used to. At first, I was still trying to eat mostly lean meats and avoided the fat, but quickly realized that in order to avoid overeating meat, I'd actually need to eat more fat. I had my first aha moment when the night before going to school, I had indulged in a lot of cheese (as a lactose-intolerant person, I will defend this), and found that the next day I felt unable to eat anything, even if I had wanted to. I was simply too full!
As for my climbing, I could go without eating for hours before and be totally fine, if not better. While the first couple of weeks were sluggish and hard to get through, I soon returned to normal and started performing as usual. While my max climbing grade was (and still is) capped by the gym's setting limits (i.e., V10 and 5.13c), I note that the volume of climbing I could do per session in addition to my onsighting grades went up, while my injury rate went down. Of course, whether this is due to a better training strategy is a whole other debate, but I simply list this here in case it is relevant. Relatedly, my weight has since climbed and remained at 72 kg (160 lbs), and many others have commented on my bigger physique, even though I cannot tell myself.

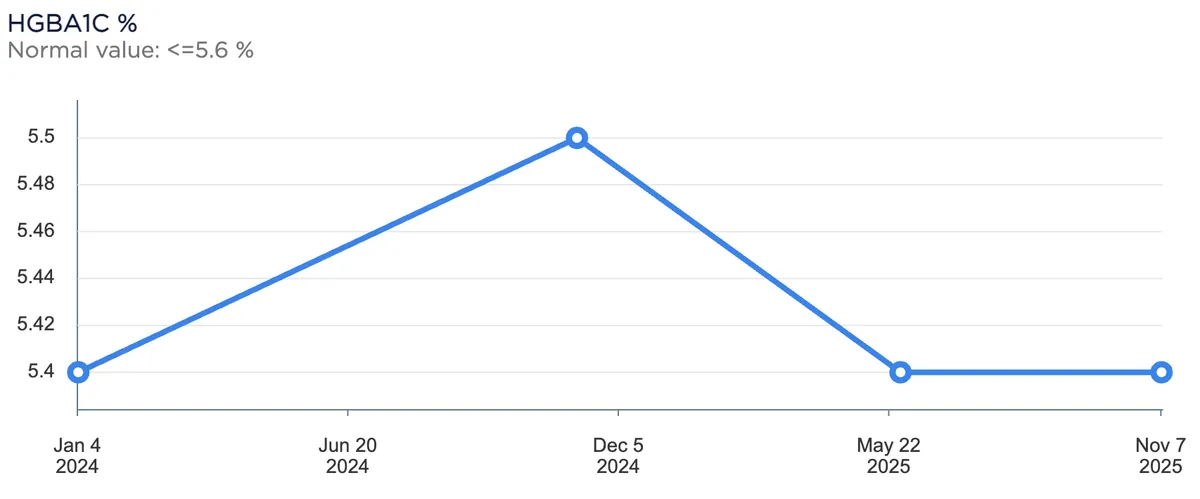
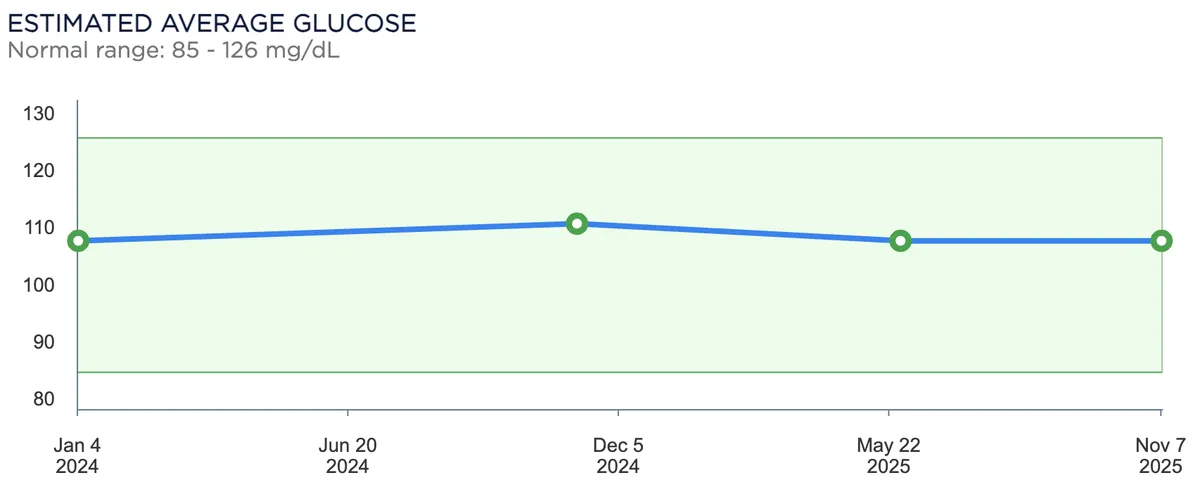
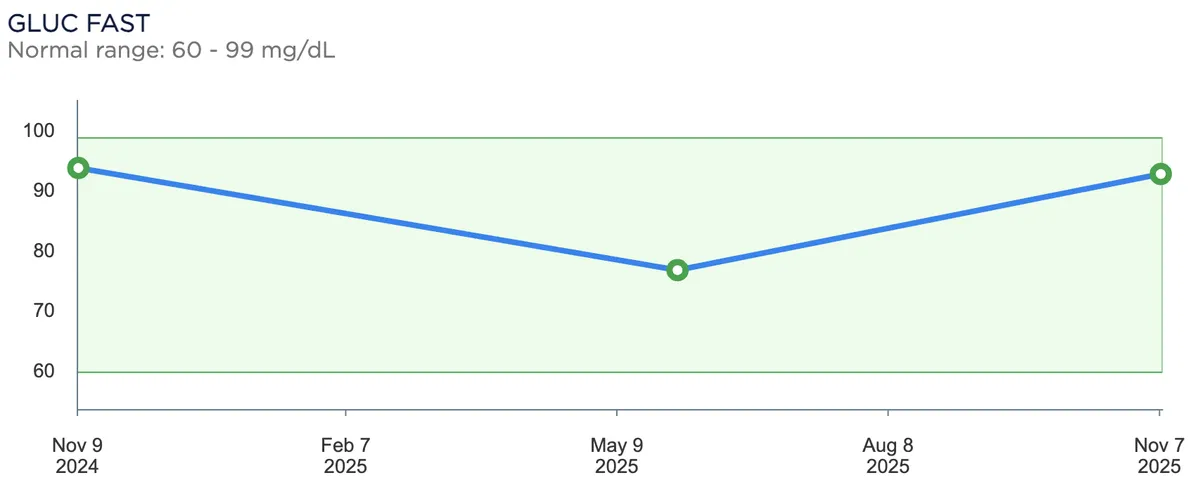
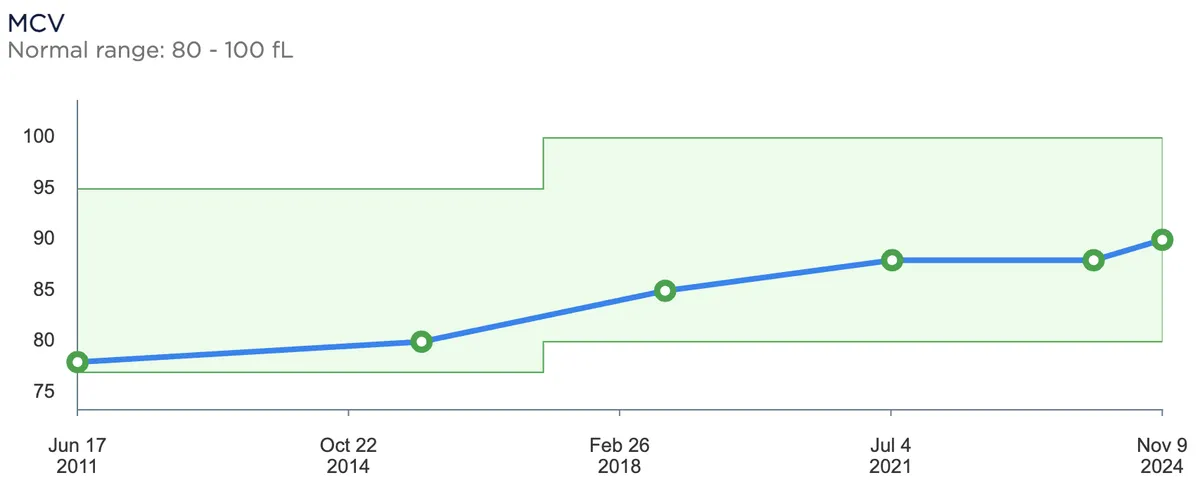
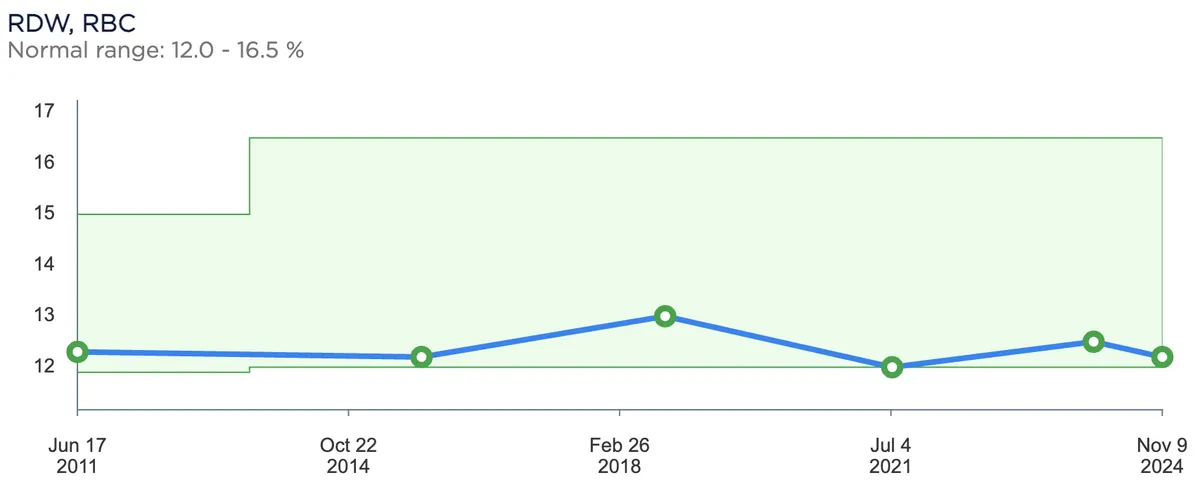
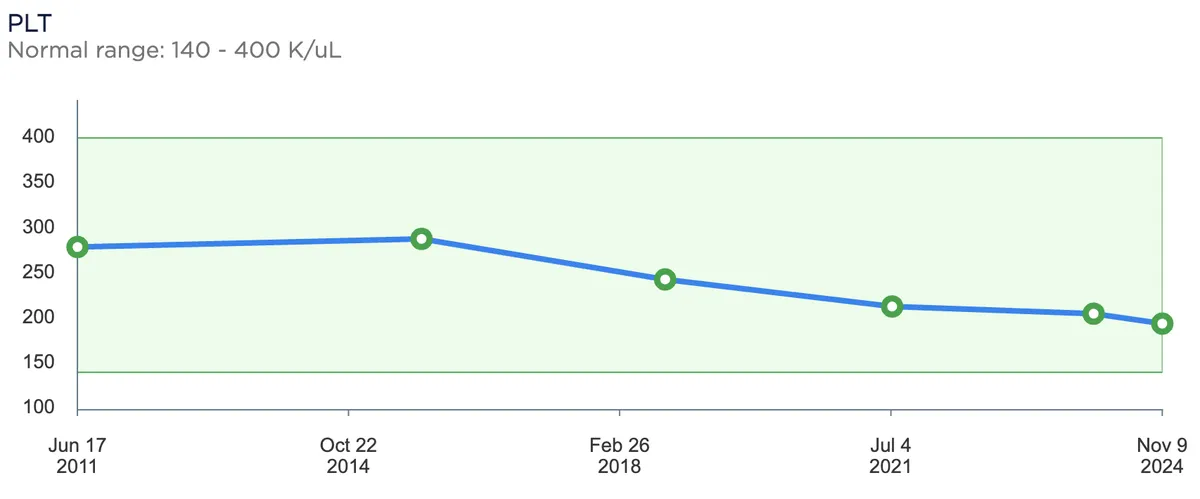
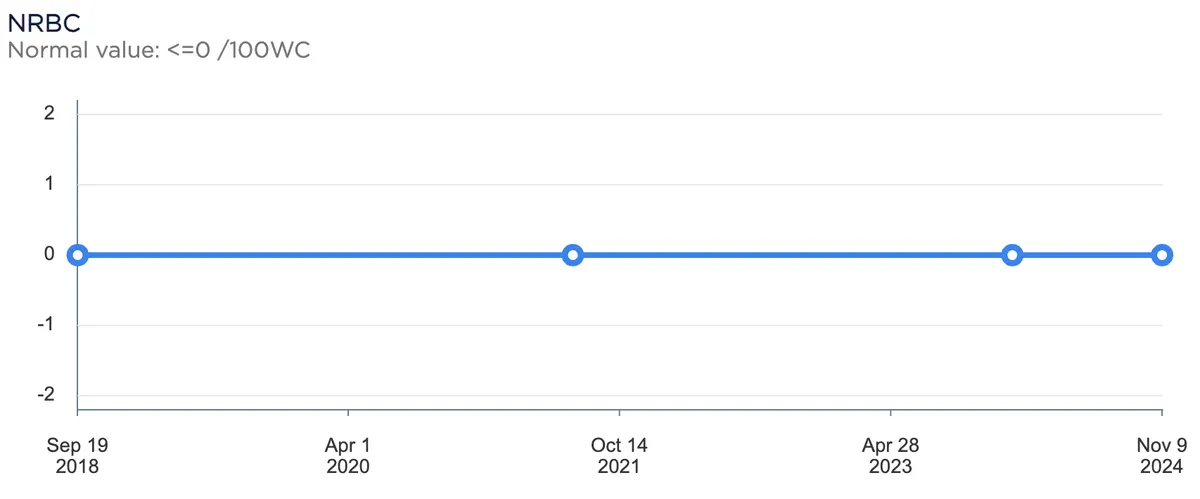
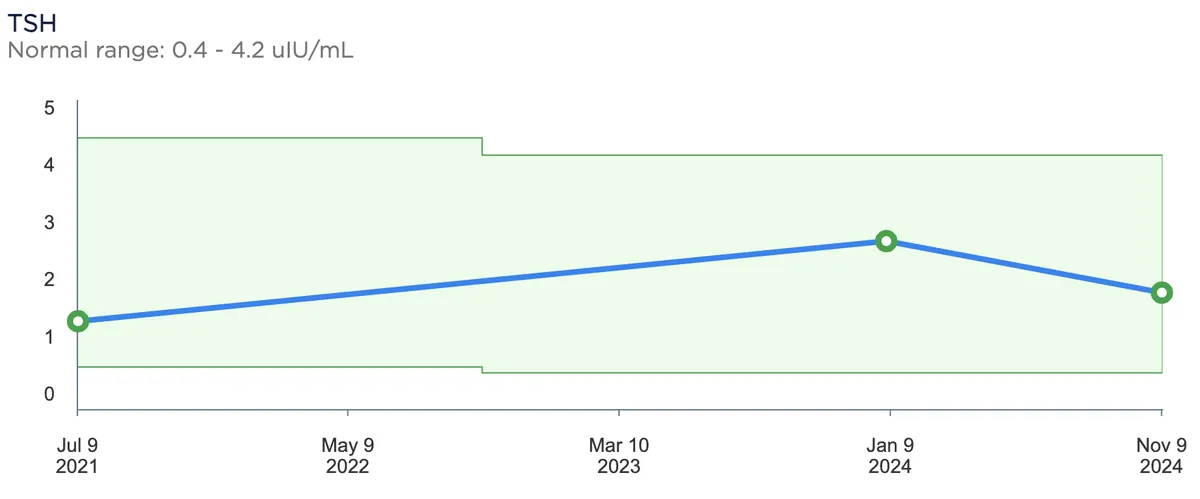
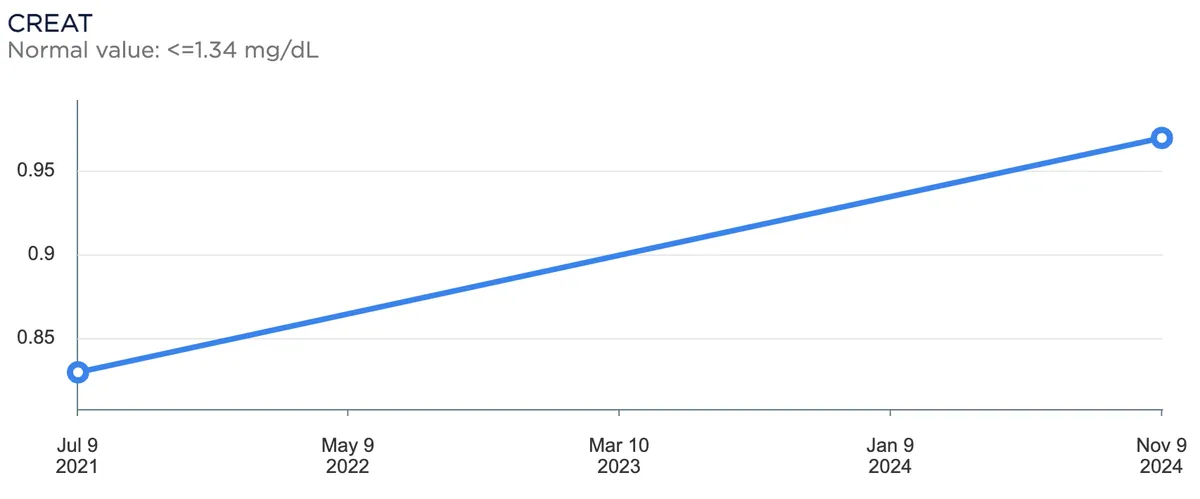
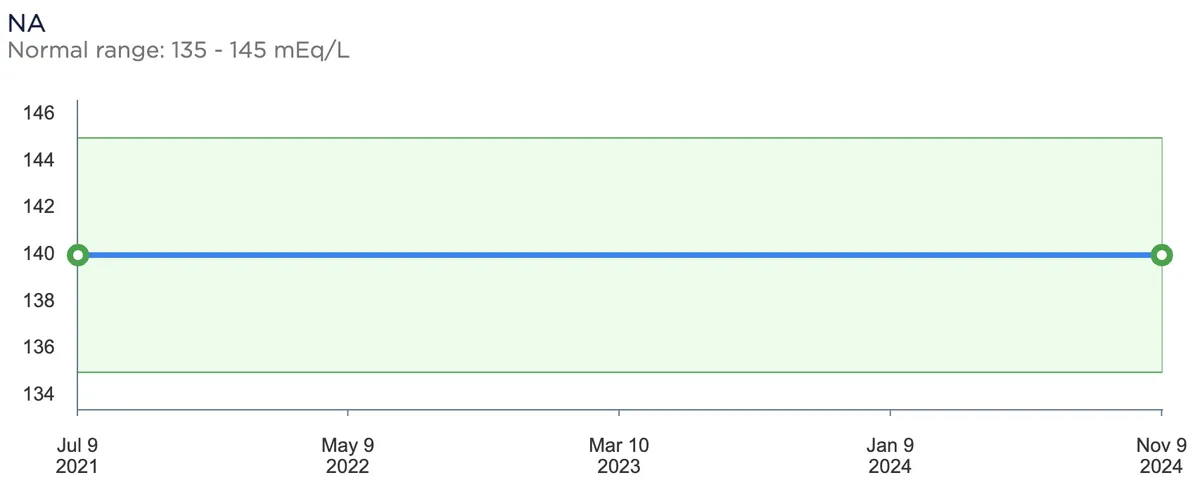
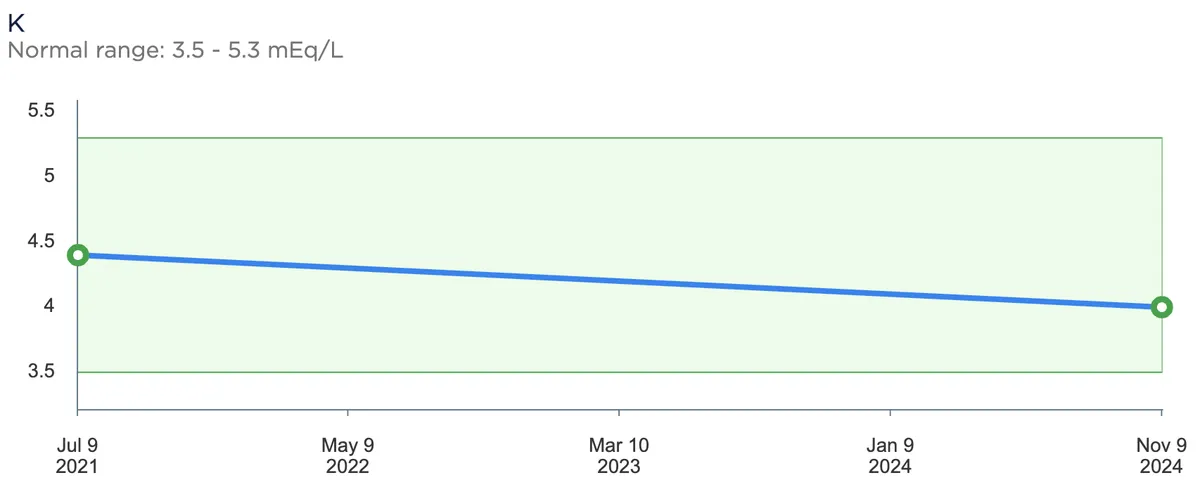
This is all good and well, but what about my health? My parents will tell you that as a kid, I'd get sick all the time. If I had to estimate, it'd likely be 6-12 months a year. After the diet, I've rarely gotten sick since then, with any incidents due to food poisoning rather than a cold. I also started taking 5000 IU of vitamin D daily, which is a huge confounder and likely makes this point weaker. Regardless, here are the results from three blood tests I've done roughly every six months (note that 1) some may contain extraneous or missing values, plz excuse my lack of scientificness, 2) tests with only one value were omitted since that would be rather useless, and 3) the x- and y- axes differ per plot):
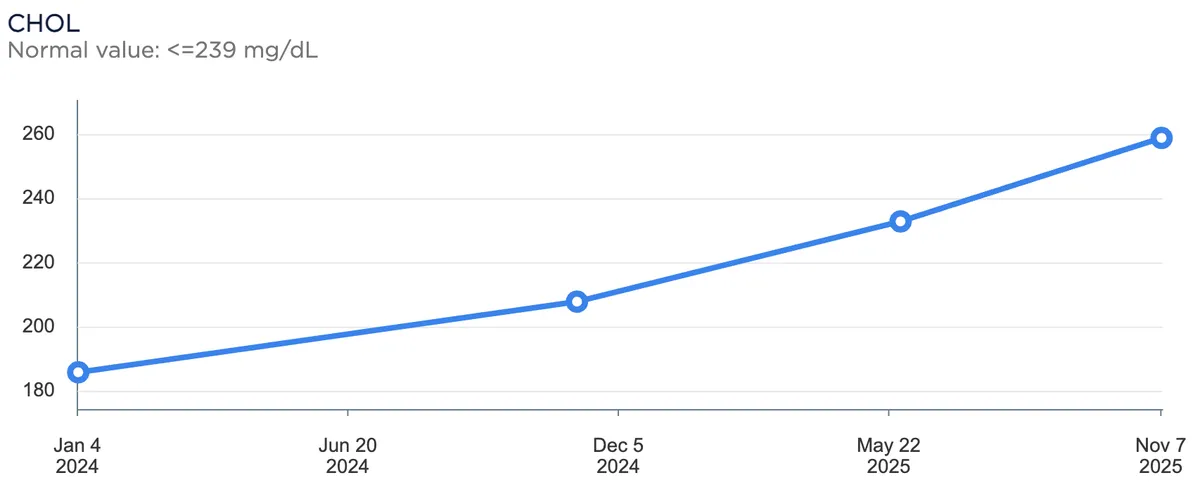
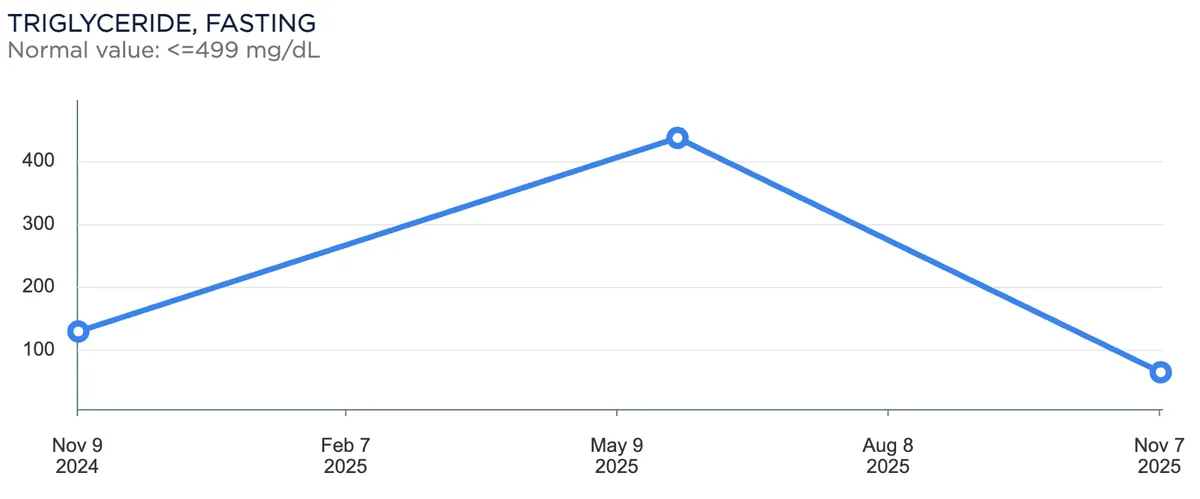
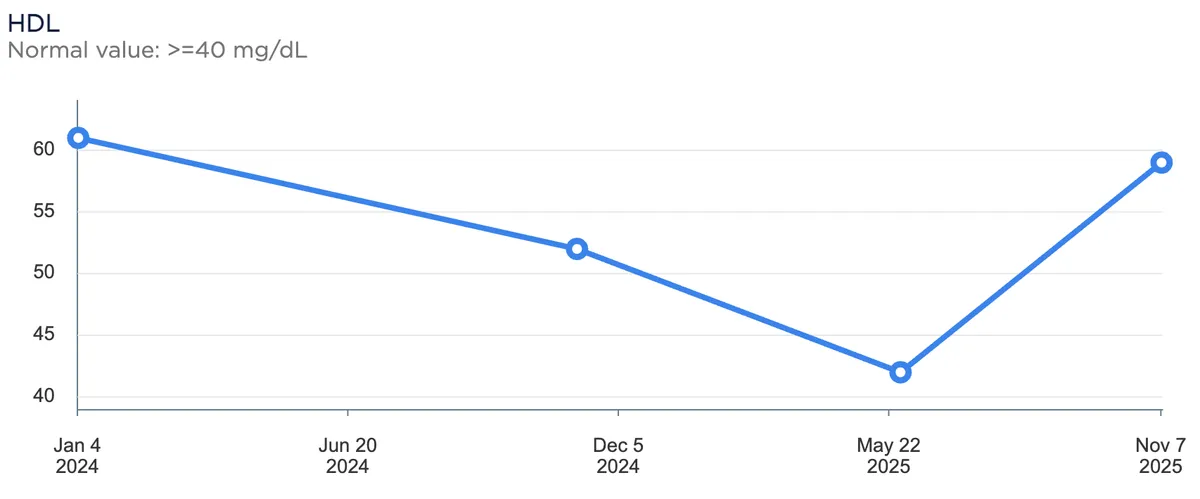
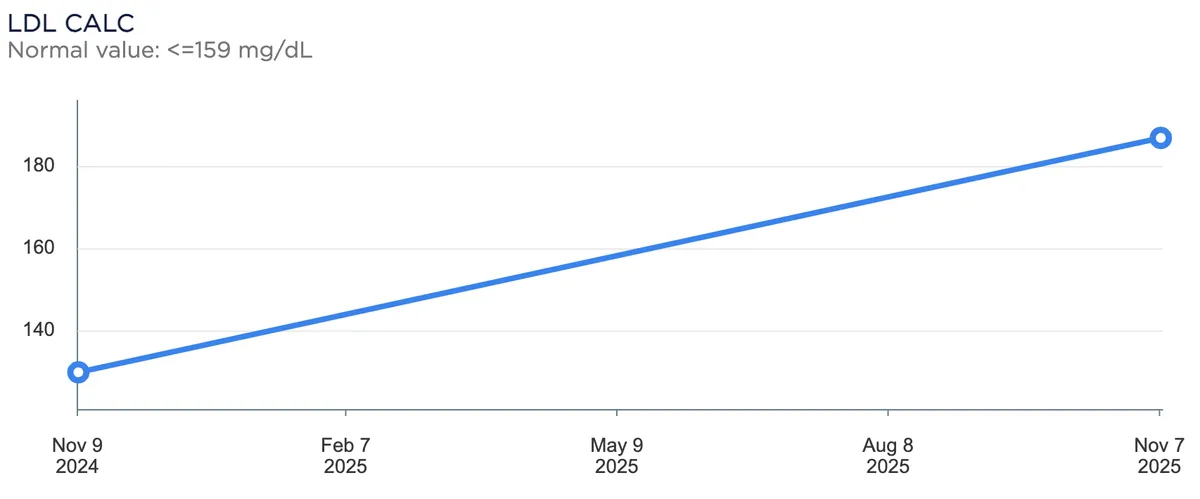
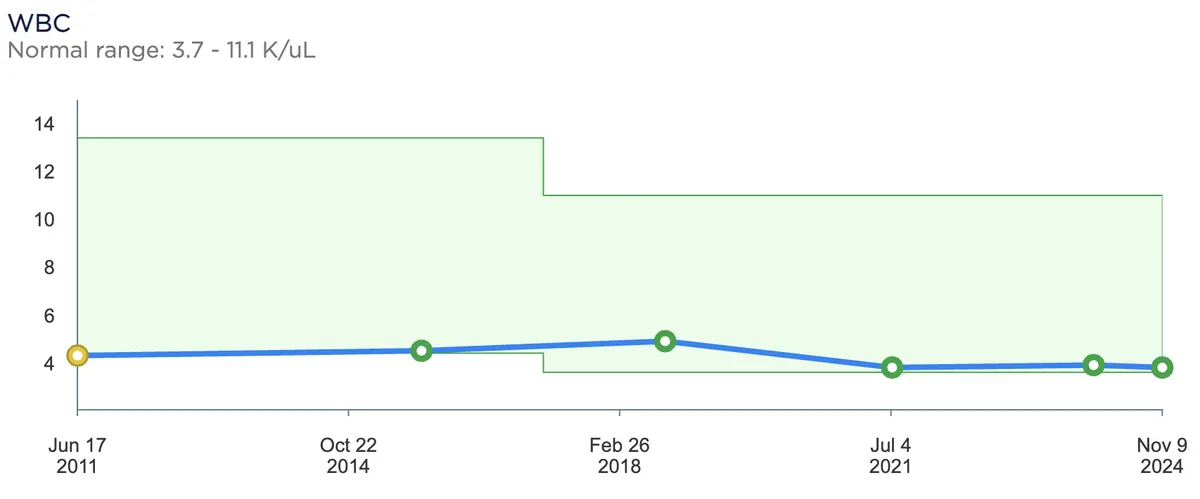
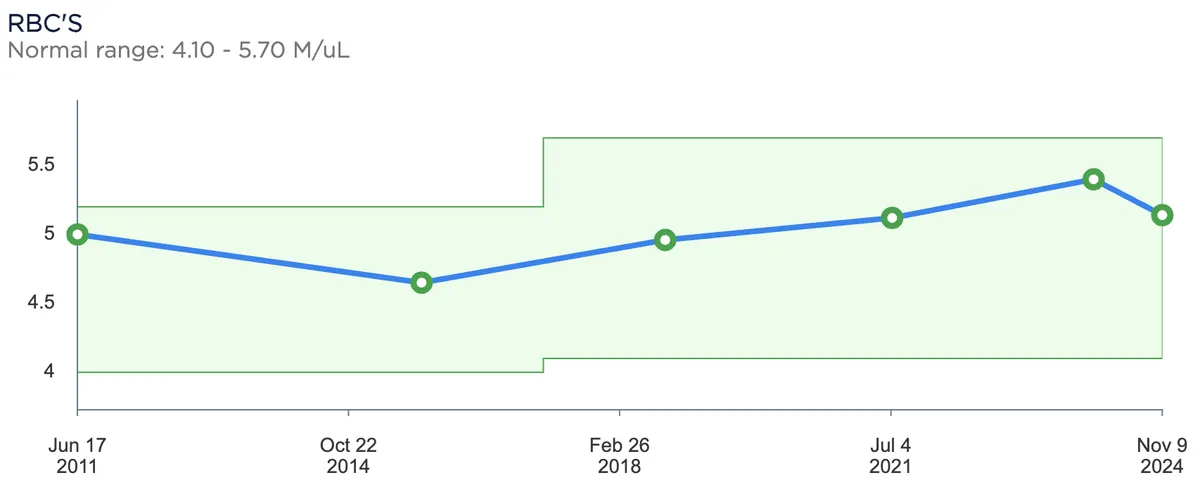
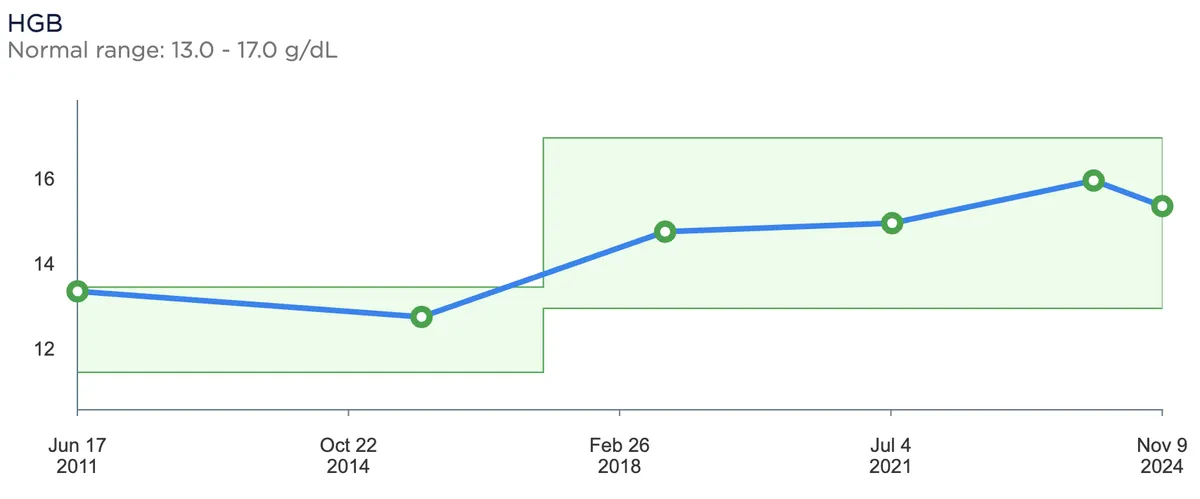
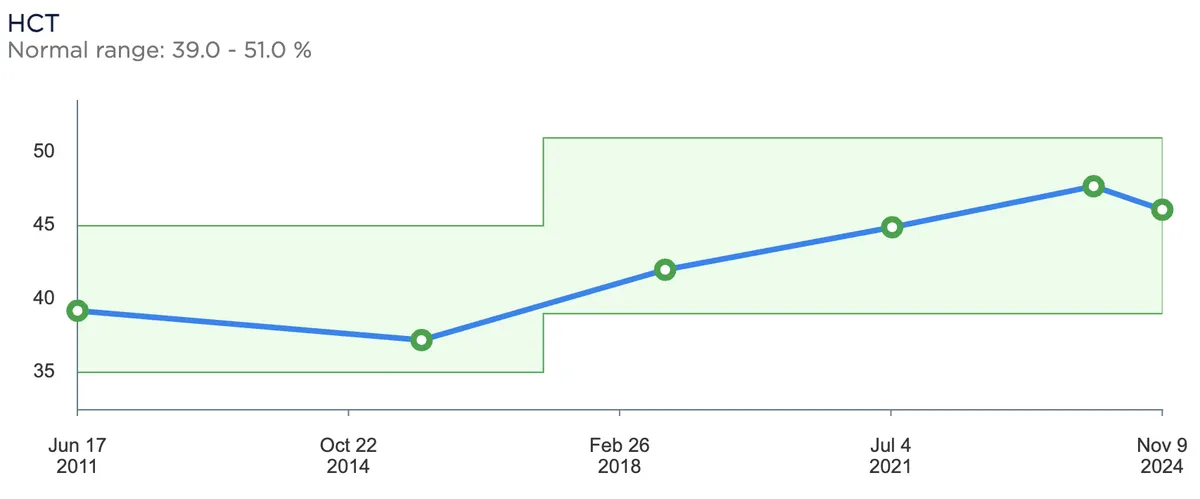
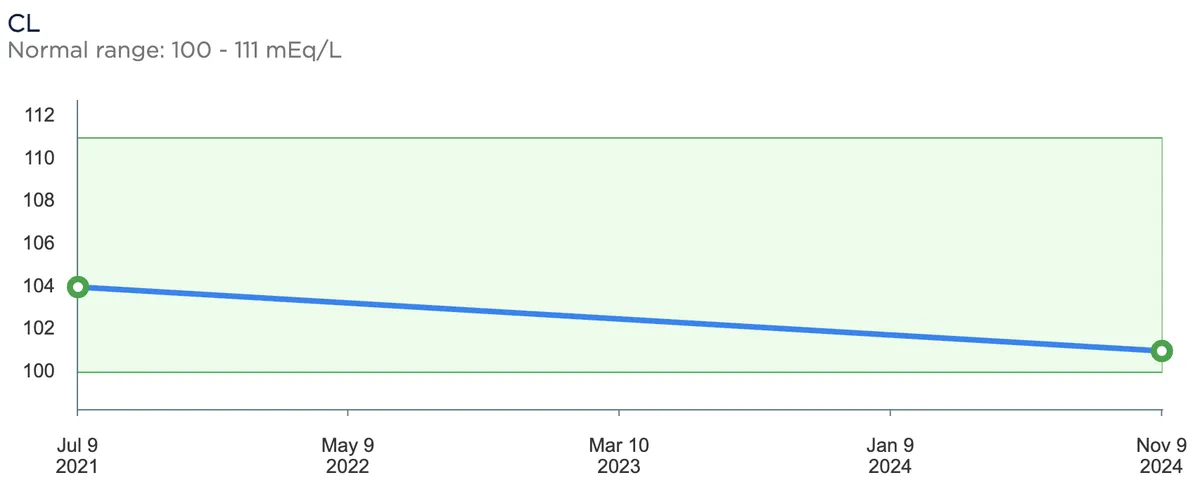
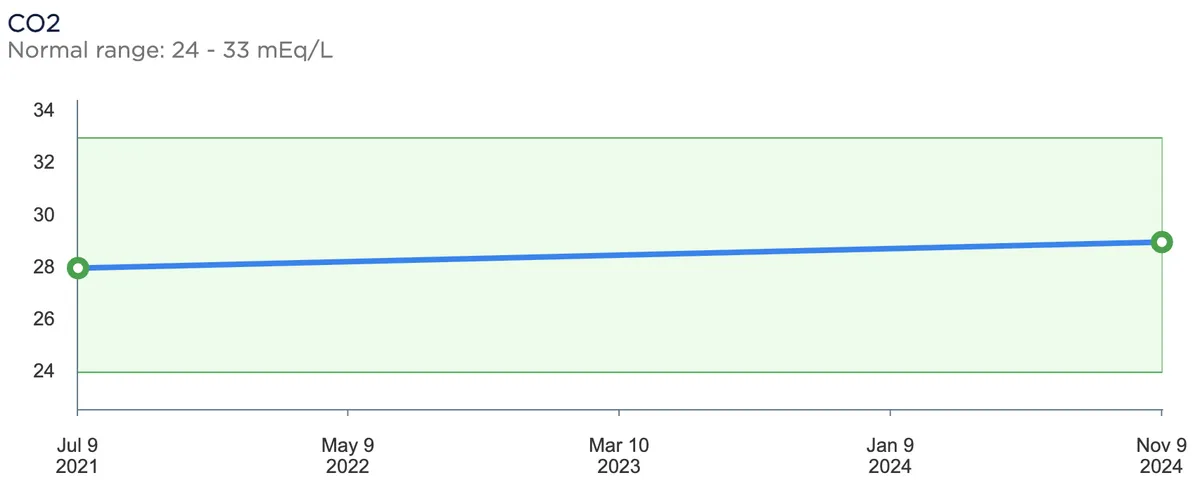
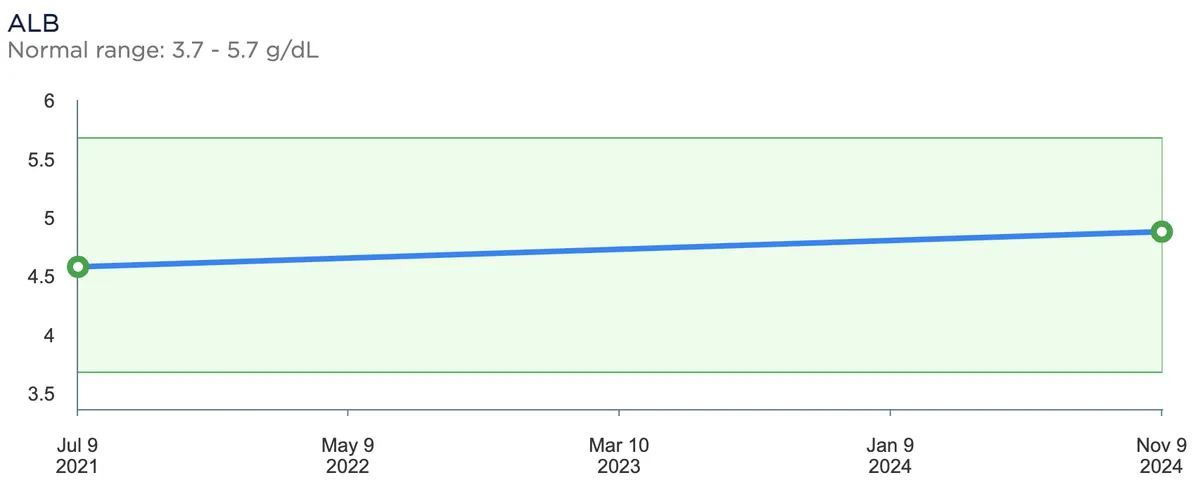
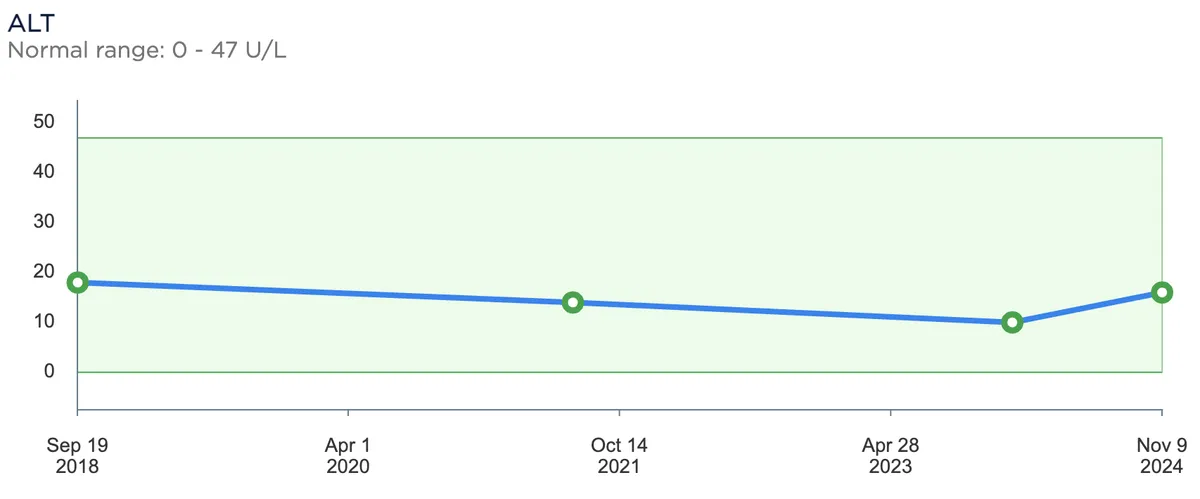
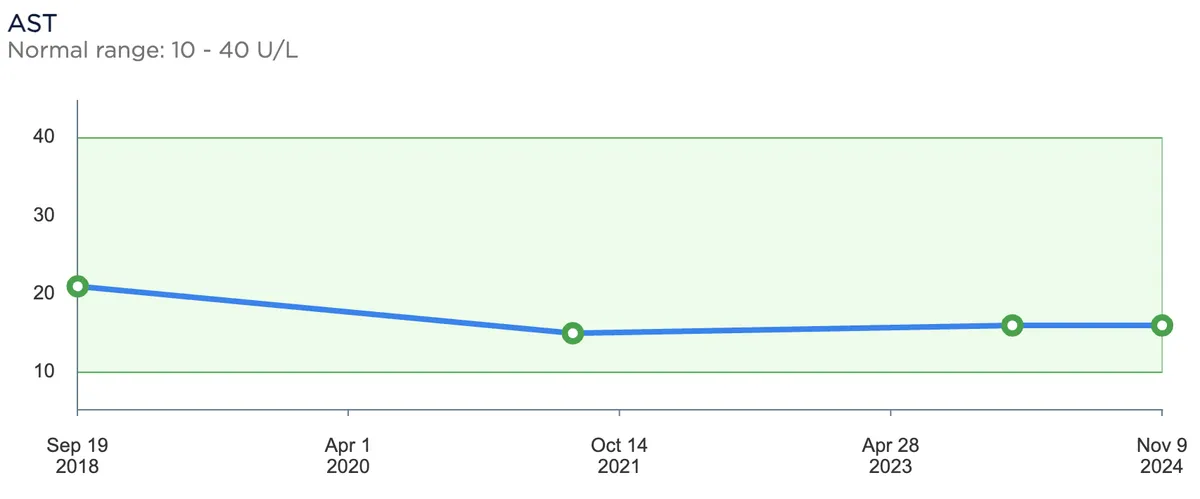
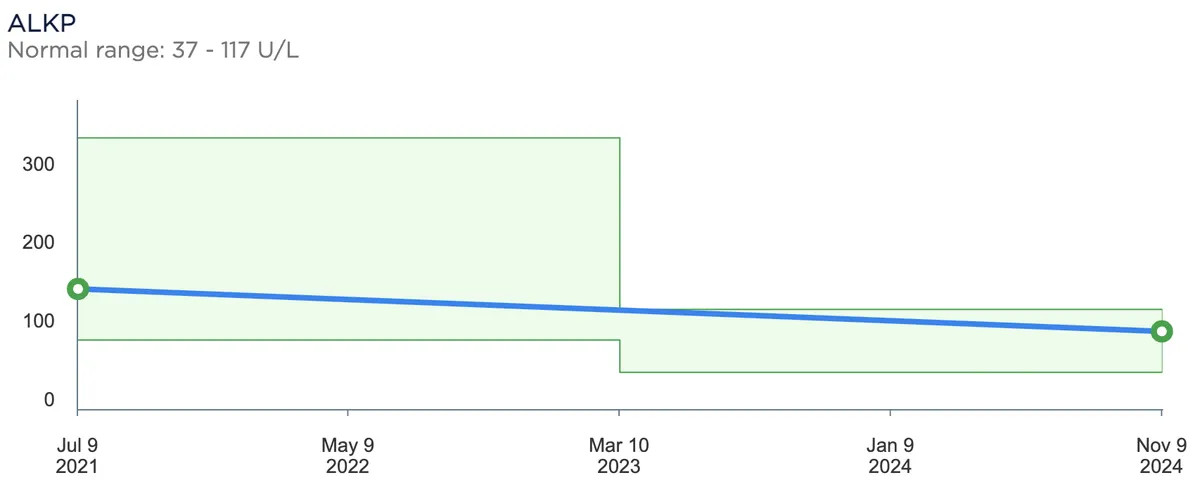
I leave these here without commentary and will address them as I get to the research later.
Research
Note: this is heavily inspired by the aforementioned ketogenic diet video by Dave Macleod in addition to his McDonald's experiment video. However, the research below differs in two ways: 1) I focus solely on health outcomes for my own interest/benefit when discussing the diet with others, and 2) I try to include more recent sources as the two videos above are slightly older than this post.
All-cause mortality
All-cause mortality is the most direct measure of long-term dietary risk, but it is also one of the least experimentally tractable. There are no long-term randomized trials assigning healthy adults to decades of ketogenic eating and measuring mortality. The available evidence is therefore mostly observational. The older low-carbohydrate meta-analyses reported small all-cause mortality increases; Noto et al., for example, pooled observational studies and found a relative risk of 1.31 (95% CI 1.07-1.59) for low-carbohydrate diets and all-cause mortality.1 However, these studies often classified diets as "low carbohydrate" at intake levels far above ketogenic ranges.
More recent pooled evidence is weaker for all-cause mortality. Qin et al. pooled 13 all-cause mortality estimates and found essentially no association for the highest versus lowest low-carbohydrate diet score (RR 1.03, 95% CI 0.96-1.10). The same paper reported a stronger coronary heart disease correlation, but that estimate came from only three studies (RR 1.43, 95% CI 1.18-1.72).2 Ghorbani et al. likewise found no clear all-cause mortality association for overall low-carbohydrate scores (HR 1.05, 95% CI 0.97-1.13) or animal-based low-carbohydrate scores (HR 1.08, 95% CI 0.97-1.21), while plant-based low-carbohydrate scores were associated with lower all-cause mortality (HR 0.87, 95% CI 0.78-0.97).3 Angelotti et al. compared participants below 45% carbohydrate with those at 45-65% and found no all-cause mortality increase (HR 0.98, 95% CI 0.87-1.11). However, the restricted-carbohydrate group averaged 41.3% of energy from carbohydrate, and the authors excluded the <26% group from the main analysis because it was too small.4
The NIH-AARP study followed 371,159 adults for a median of 23.5 years and recorded 165,698 deaths. In the highest versus lowest quintile, overall and unhealthy low-carbohydrate scores were associated with higher mortality in the range of HR 1.12-1.18, while the healthy low-carbohydrate score was associated with slightly lower total mortality (HR 0.95, 95% CI 0.94-0.97).5 In substitution analysis, replacing 3% of energy from low-quality carbohydrate with plant protein was associated with lower total mortality (HR 0.90, 95% CI 0.89-0.91).5
UK Biobank also found a nonlinear relationship. In 195,658 participants, 4,780 died over a mean 10.6 years. Carbohydrate intake was not associated with mortality from 20-50% of energy, but mortality rose at 60-70% versus 50% of energy (3.14 vs 2.75 deaths per 1000 person-years; average HR 1.14, 95% CI 1.03-1.28).6
In short, carbohydrate restriction itself has not been shown to shorten life, but decades-long ketogenic safety is also not established.
Saturated fat
Saturated fat is a primary concern for ketogenic diets because fat supplies much of the energy. In the United States, the 2020-2025 federal dietary guidance recommended limiting saturated fat to less than 10% of total calories, which a ketogenic diet can easily exceed,7 and the AHA's 2021 scientific statement on dietary guidance for cardiovascular health reiterated that sentiment while emphasizing whole dietary patterns over single nutrients.8 The concern traces back to the diet-heart hypothesis: Keys' early work linked fat intake with heart-disease mortality,9 even though a later analysis using more countries found a weaker and more complicated relationship.10
The observational literature remains inconsistent. A 2010 meta-analysis of prospective cohorts found no significant association between high versus low saturated-fat intake and coronary heart disease (RR 1.07, 95% CI 0.96-1.19), stroke (RR 0.81, 95% CI 0.62-1.05), or overall cardiovascular disease (RR 1.00, 95% CI 0.89-1.11).11 Other comparisons, especially outside the United States, point in the opposite direction. Grasgruber's 42-country European analysis found meat consumption inversely correlated with total CHD mortality (r = -0.43 in men; r = -0.49 in women), while animal fat plus animal protein correlated positively with raised cholesterol (r = 0.92 in men; r = 0.88 in women).12 Note that health expenditure was similarly correlated, pointing to ecological confounding. Even in better-controlled comparisons, vegetarian and nonvegetarian mortality look similar: in a UK pooled cohort, all-cause mortality compared with regular meat eaters was HR 0.93 (95% CI 0.86-1.00) for low meat eaters, HR 0.96 (95% CI 0.86-1.06) for fish eaters, and HR 1.02 (95% CI 0.94-1.10) for vegetarians.13
In the PURE study where 135,335 adults were tracked across 18 countries, higher carbohydrate intake was associated with higher total mortality (highest versus lowest quintile HR 1.28, 95% CI 1.12-1.46), while higher total fat (HR 0.77, 95% CI 0.67-0.87) and saturated fat (HR 0.86, 95% CI 0.76-0.99) were associated with lower total mortality. Saturated fat was also associated with lower stroke risk (HR 0.79, 95% CI 0.64-0.98), but not with myocardial infarction or cardiovascular mortality.14 Dairy showed similar associations in a related PURE analysis of 136,384 adults: more than two servings per day versus none was associated with lower total mortality (HR 0.83, 95% CI 0.72-0.96), major cardiovascular disease (HR 0.78, 95% CI 0.67-0.90), and stroke (HR 0.66, 95% CI 0.53-0.82), while butter intake was not significantly associated with clinical outcomes (HR 1.09, 95% CI 0.90-1.33).15 Newer biomarker work adds another complication because circulating saturated fatty acid subtypes do not all track risk in the same direction.16 To make things murkier, Archer and Ioannidis' criticisms of nutrition epidemiology are directly relevant here.17
Ornish's well-known lifestyle trial changed diet, smoking, exercise, social support, and stress management simultaneously, so it cannot identify low fat as the active variable.18 The Women's Health Initiative was far larger and more directly tested a low-fat dietary pattern in 48,835 postmenopausal women. By year 6, the intervention group had reduced total fat by about 8.2% of energy compared with control and saturated fat by about 2.9%. Even so, after about eight years it did not reduce CHD (HR 0.97, 95% CI 0.90-1.06), stroke (HR 1.02, 95% CI 0.90-1.15), or total cardiovascular disease (HR 0.98, 95% CI 0.92-1.05).19 The companion cancer trials likewise did not show clear reductions in invasive breast cancer (HR 0.91, 95% CI 0.83-1.01) or colorectal cancer (HR 1.08, 95% CI 0.90-1.29).20,21
The older fat-replacement trials remain important. In the Minnesota Coronary Experiment, saturated fat was reduced from about 18% to 9% of calories and replaced largely with corn oil. The intervention reduced serum cholesterol more than control (-13.8% versus -1.0%), but recovered data found no mortality benefit; each 30 mg/dL reduction in serum cholesterol was associated with 22% higher mortality in adjusted Cox models.22 The Sydney Diet Heart Study found increased deaths when saturated fat was replaced with linoleic-acid-rich polyunsaturated fat: all-cause mortality HR 1.62 (95% CI 1.00-2.64), cardiovascular mortality HR 1.70 (95% CI 1.03-2.80), and coronary heart disease mortality HR 1.74 (95% CI 1.04-2.92).23
More recent trial syntheses such as Cochrane's 2020 review found little or no effect of reducing saturated fat on all-cause mortality (RR 0.96, 95% CI 0.90-1.03; 11 trials, 55,858 participants) or cardiovascular mortality (RR 0.95, 95% CI 0.80-1.12; 10 trials, 53,421 participants), but it did find a 21% reduction in combined cardiovascular events (RR 0.79, 95% CI 0.66-0.93; 11 trials, 53,300 participants). Subgrouping did not show significant differences by replacement nutrient, though point estimates favored polyunsaturated-fat replacement.24 A 2024 umbrella review reached a similar interpretation.25 A stricter 2025 RCT-only meta-analysis was more skeptical, finding no significant effect on all-cause mortality, cardiovascular mortality, myocardial infarction, or coronary events, though none of its included trials were low risk of bias.26 Controlled-feeding and substitution evidence point to saturated fat reliably raising LDL-C compared with unsaturated fats in metabolic ward data, while cohort substitution models tend to favor replacing saturated fat with polyunsaturated fat or whole grains rather than refined carbohydrate.27,28,29,30 In the NHS and HPFS pooled analysis, isocalorically replacing 5% of energy from saturated fat with polyunsaturated fat, monounsaturated fat, or whole-grain carbohydrate was associated with 27% (HR 0.73, 95% CI 0.70-0.77), 13% (HR 0.87, 95% CI 0.82-0.93), and 14% (HR 0.86, 95% CI 0.83-0.89) lower total mortality, respectively, while replacement with refined carbohydrate or sugar showed no benefit.31
LDL cholesterol remains the most important unresolved issue for ketogenic diets. In one small study of elite male ultra-endurance runners, the low-carbohydrate group (n=10) had much higher LDL-C than the high-carbohydrate group (83% higher), despite fewer small LDL particles.32 A 2023 umbrella review of ketogenic-diet meta-analyses found high-quality evidence for increased LDL-C at 12 months in adults with type 2 diabetes (mean difference 6.35 mg/dL, 95% CI 2.02-10.69), alongside high-quality evidence for lower triglycerides.33 A 2025 RCT meta-analysis of carbohydrate-restricted diets likewise reported lower triglycerides and blood pressure but flagged LDL elevation as a possible adverse effect.34 Weight loss itself can raise LDL transiently.35 Because LDL-C measures cholesterol mass rather than particle number, ApoB may be more informative when LDL-C, triglycerides, and LDL particle size move in different directions; pooled analyses of UK Biobank and the FOURIER and IMPROVE-IT trials suggest apoB largely captures the risk attributable to apoB-containing lipoproteins, with non-HDL-C and triglycerides adding little after adjustment.36,37 This sits against a large genetic, epidemiologic, and randomized-drug literature arguing that cumulative LDL exposure is causal for atherosclerotic cardiovascular disease, including evidence that LDL-C levels currently considered "normal" are independently associated with the presence and extent of subclinical atherosclerosis in middle-aged adults free of conventional risk factors, so I do not draw strong conclusions here.38,39
The evidence pointing in the opposite direction is at the very least interesting. A Japanese cohort found higher LDL associated with better all-cause survival; in REGARDS high-risk adults, lower hs-CRP was associated with lower stroke and coronary risk among those with LDL-C >=70 mg/dL, while LDL-C <70 mg/dL was not protective among those with high hs-CRP and was associated with higher all-cause mortality in imputed analyses; another analysis suggested LDL-C risk thresholds depend partly on lipoprotein(a).40,41,42 A small ketogenic-diet imaging study in people with very high LDL-C is relevant but doesn't establish long-term safety.43 A 5-year extension of the Virta continuous-care type 2 diabetes intervention provides rare medium-term observational data on a clinically supervised low-carbohydrate protocol with nutritional ketosis, but is not randomized and is sponsor-affiliated.44
In short, saturated-fat reduction does not clearly reduce mortality, but randomized evidence suggests fewer combined CVD events when saturated fat is reduced or replaced in some contexts.
Red meat
Red meat is distinct from saturated fat and should be analyzed separately. The Burden of Proof analysis on unprocessed red meat included 55 reports, 37 prospective cohorts, and one nested case-control study, and found weak associations: the conservative exposure-averaged estimates were a 6% higher colorectal-cancer risk, 3% higher breast-cancer risk, 1% higher ischemic-heart-disease risk, and 1% higher type 2 diabetes risk compared with no red meat.45 At specific intake levels, the mean colorectal-cancer RR was larger, 1.30 (95% uncertainty interval 1.01-1.64) at 50 g/day and 1.37 (1.01-1.78) at 100 g/day, but the authors still rated the evidence weak because the uncertainty intervals were wide and between-study heterogeneity was large.45 Critics of Burden of Proof argue that its uncertainty framework may be too conservative and that it does not answer the substitution question: what replaced the meat?46 A newer Burden of Proof analysis on processed meat still used two-star ratings, yet conservatively estimated that 0.6-57 g/day was associated with at least an 11% higher type 2 diabetes risk and 0.78-55 g/day with at least a 7% higher colorectal-cancer risk, so limiting processed meat is still reasonable at the population level.47 NutriRECS is the notable dissenting guideline: it issued weak recommendations that adults continue current red and processed meat intake, but that conclusion was widely criticized for how it weighted low-certainty evidence against small population-level risks.48
Global data do not support the claim that all red meat intake is uniformly harmful. A 2023 European Heart Journal meta-analysis included 43 observational studies for cardiovascular disease (4,462,810 participants) and 27 for diabetes (1,760,774 participants). Per 100 g/day, unprocessed red meat was associated with higher cardiovascular disease risk (HR 1.11, 95% CI 1.05-1.16) and diabetes risk (HR 1.27, 95% CI 1.16-1.39); per 50 g/day, processed red meat was higher still for cardiovascular disease (HR 1.26, 95% CI 1.18-1.35) and diabetes (HR 1.44, 95% CI 1.27-1.63).49 A 2024 individual-participant federated meta-analysis similarly found higher type 2 diabetes incidence per 100 g/day of unprocessed red meat (HR 1.10, 95% CI 1.06-1.15) and per 50 g/day of processed meat (HR 1.15, 95% CI 1.11-1.20).50 Umbrella reviews show a similar pattern: processed meat and diabetes outcomes are more consistent than unprocessed red meat for cardiovascular mortality.51,52 In PURE, 134,297 adults from 21 countries were followed for 9.5 years, with 7,789 deaths and 6,976 major cardiovascular events recorded. Higher unprocessed red meat intake, defined as at least 250 g/week versus less than 50 g/week, was not significantly associated with mortality (HR 0.93, 95% CI 0.85-1.02) or major cardiovascular disease (HR 1.01, 95% CI 0.92-1.11), while higher processed meat intake, at least 150 g/week versus none, was associated with both mortality (HR 1.51, 95% CI 1.08-2.10) and major cardiovascular disease (HR 1.46, 95% CI 1.08-1.98).53 Earlier work in the NHS and HPFS pooled cohorts (37,698 men and 83,644 women, 23,926 deaths over up to 28 years) reported per-serving HRs of 1.13 (95% CI 1.07-1.20) for unprocessed red meat and 1.20 (1.15-1.24) for processed red meat for total mortality, with substitution by fish, poultry, nuts, legumes, low-fat dairy, or whole grains projected to lower mortality risk by 7-19%.54 A more recent harmonized analysis of six US cohorts (n=29,682) found that each additional 2 servings per week of processed meat (HR 1.07, 95% CI 1.04-1.11) or unprocessed red meat (HR 1.03, 95% CI 1.01-1.06) was associated with higher incident CVD, while fish intake was not significantly associated with CVD or all-cause mortality.55 Some Asian and European datasets also report neutral or inverse associations for meat or animal protein.56 This suggests some red-meat associations may be partly confounded by Western ultra-processed dietary patterns and replacement foods, although a 2025 three-cohort analysis found the diabetes association persisted even among participants with relatively high diet quality.57
In a 2023 substitution meta-analysis of 37 publications from 24 cohorts, replacing 50 g/day of processed meat with nuts, legumes, or whole grains was associated with lower total cardiovascular disease risk: SHR 0.73 (95% CI 0.59-0.91), 0.77 (0.68-0.87), and 0.64 (0.54-0.75), respectively.58 For type 2 diabetes, replacing 50 g/day of red meat with nuts or whole grains/cereals was associated with lower incidence: SHR 0.92 (95% CI 0.90-0.94) and 0.90 (0.84-0.96). For all-cause mortality, replacing 50 g/day of red meat with nuts had an SHR of 0.93 (95% CI 0.91-0.95), and replacing processed meat with nuts had an SHR of 0.79 (95% CI 0.71-0.88).58 Randomized risk-factor trials show that red meat was not worse than all comparison diets pooled, but replacing red meat with high-quality plant proteins produced more favorable LDL and total-cholesterol changes.59 In the APPROACH controlled-feeding trial, red and white meat both raised LDL-C and apoB more than nonmeat protein, regardless of saturated-fat background.60 Another randomized crossover feeding study found that red meat increased TMAO compared with white meat or nonmeat protein, and TMAO fell again after red meat was removed.61
IARC classifies processed meat as carcinogenic and red meat as probably carcinogenic; importantly, this is a hazard classification, not a personalized risk estimate.62,63 WCRF/AICR still treats red and processed meat as important colorectal-cancer exposures, with earlier WCRF dose-response estimates around RR 1.12 (95% CI 1.00-1.25) per 100 g/day of red meat.64,45 A 2025 prospective-study meta-analysis also found significant positive associations between red and processed meat consumption and colorectal-cancer risk.65 Singh et al. followed 32,051 Adventist Health Study participants for 6 years and found higher colon-cancer risk for red meat at least once per week versus none (RR 1.90, 95% CI 1.16-3.11), an inverse association for legumes two or more times per week versus less than once per week (RR 0.53, 95% CI 0.33-0.86), and a more than threefold higher risk pattern among people with high red meat, low legumes, and higher body mass.66
A UK Biobank analysis of 399,586 adults followed for 12 years found a small inverse association between highest versus lowest raw vegetable intake and cardiovascular disease incidence (HR 0.89, 95% CI 0.83-0.95) and mortality (HR 0.85, 95% CI 0.74-0.97), but cooked vegetable intake was null. Adjustment for socioeconomic status, health status, and lifestyle reduced the likelihood-ratio statistics for the raw-vegetable associations by 82% for incidence and 87% for mortality.67
Mainstream LCAs and food-system inventories generally rank ruminant meat, especially beef and lamb, above staple plant foods for greenhouse-gas emissions and land use under common functional units, with large farm-to-farm variation but a persistently high average impact.68,69,70 Xu et al. estimated global food-production emissions at 17,318 +/- 1,675 Tg CO2-equivalent per year around 2010; animal-based foods, including feed production assigned to livestock, accounted for 57%, plant-based foods for 29%, and other uses for 14%.69 FAO's 2023 livestock assessment estimated livestock agrifood systems at about 6.2 Gt CO2-equivalent in 2015, roughly 12% of anthropogenic greenhouse-gas emissions.70 Protein-quality adjustments can make animal foods look better than simple grams-of-protein comparisons, but they do not by themselves overturn the high average climate and land-use footprint of ruminant meat.71,72
GWP100 is the standard metric used in most greenhouse-gas inventories, but the IPCC notes that metric choice depends on the policy question. GWP* can better approximate warming from changes in short-lived methane emission rates: rising methane adds warming, falling methane can reduce warming, and stable methane emissions sustain prior warming and add little additional warming after the atmospheric stock equilibrates. It does not make cattle climate-neutral by itself and is controversial as an offset or policy-accounting metric.73,74,75,76,77 IPCC and FAO sources still treat enteric methane as a major agricultural emissions source; EEA makes the same point for Europe specifically.78,70,79
Soil carbon and grazing can improve or worsen the environmental picture depending on the land, stocking rate, baseline degradation, climate, and counterfactual land use. Soil organic carbon is difficult to integrate into LCAs, and sequestration estimates are finite, reversible, saturation-limited, and difficult to verify.80,81 Reviews of grazing management find mixed effects on soil carbon, biomass, and biodiversity; regenerative or adaptive grazing can help in some contexts but it is not generally true that beef is climate-neutral.82,83,84 In other words, production system, feed, methane trajectory, land opportunity cost, soil, biodiversity, welfare, and nutrient density all determine the environmental effects of eating red meat.85,86
In short, unprocessed red meat is confounded by amount, replacement food, overall diet quality, and production system, while the evidence is stronger and more consistently adverse for processed red meat than for unprocessed red meat. Environmentally, ruminant meat (especially beef and lamb) carries a higher average climate and land-use footprint than staple plant foods under common LCA functional units, even after protein-quality adjustment; GWP* and soil-carbon sequestration soften but do not erase that gap.
Conclusions
Looking back at my blood panel results, I see mixed results. HbA1c stayed around 5.4-5.5%, fasting glucose stayed within the plotted range, and the kidney, electrolyte, albumin, liver-enzyme, and CBC plots mostly stayed inside their reference bands. Creatinine rose slightly but remained below the shown cutoff; platelets drifted down over time but stayed in range; NRBC stayed at zero. The lipid plots are the main exception. HDL dipped and then recovered, and fasting triglycerides spiked once before falling sharply, but total cholesterol rose steadily and calculated LDL rose above the chart's cutoff on the latest point.
Tying this back to the research, while carbohydrate restriction itself has not been shown to shorten life and unprocessed red meat looks heavily confounded, LDL/ApoB remains the most important unresolved keto-specific risk signal, and the climate and land-use footprint of ruminant meat is the most consistent environmental concern. In other words, I think it's useful to keep monitoring LDL, consider adding ApoB, watch triglycerides and total cholesterol, limit processed meat, and prefer better-produced sources (lower-impact production systems, better land use, higher welfare) where I can.
References
Noto, H., et al., Low-Carbohydrate Diets and All-Cause Mortality: A Systematic Review and Meta-Analysis of Observational Studies, PLoS One, 2013. https://doi.org/10.1371/journal.pone.0055030; Mazidi, M., et al., Lower carbohydrate diets and all-cause and cause-specific mortality: a population-based cohort study and pooling of prospective studies, European Heart Journal, 2019. https://pubmed.ncbi.nlm.nih.gov/31004146/; Seidelmann, S.B., et al., Dietary carbohydrate intake and mortality: a prospective cohort study and meta-analysis, The Lancet Public Health, 2018. https://pubmed.ncbi.nlm.nih.gov/30122560/↩
Qin, P., et al., Low-carbohydrate diet and risk of cardiovascular disease, cardiovascular and all-cause mortality: a systematic review and meta-analysis of cohort studies, Food & Function, 2023. https://doi.org/10.1039/D3FO01374J↩
Ghorbani, Z., et al., Overall, plant-based, or animal-based low carbohydrate diets and all-cause and cause-specific mortality: A systematic review and dose-response meta-analysis of prospective cohort studies, Ageing Research Reviews, 2023. https://doi.org/10.1016/j.arr.2023.101997↩
Angelotti, A., et al., Carbohydrate intake and mortality in NHANES 1999-2018, Frontiers in Nutrition, 2024. https://www.frontiersin.org/articles/10.3389/fnut.2024.1225674/full↩
Zhao, Y., et al., Low-carbohydrate-diet scores and mortality in adults from the NIH-AARP Diet and Health Study, Journal of Internal Medicine, 2023. https://doi.org/10.1111/joim.13639↩
Ho, F.K., et al., Associations of fat and carbohydrate intake with cardiovascular disease and mortality: prospective cohort study of UK Biobank participants, BMJ, 2020. https://doi.org/10.1136/bmj.m688↩
U.S. Department of Agriculture and U.S. Department of Health and Human Services, Dietary Guidelines for Americans, 2020-2025, 9th ed. https://www.dietaryguidelines.gov/sites/default/files/2020-12/Dietary_Guidelines_for_Americans_2020-2025.pdf↩
Lichtenstein, A.H., et al., 2021 Dietary Guidance to Improve Cardiovascular Health: A Scientific Statement From the American Heart Association, Circulation, 2021. https://pubmed.ncbi.nlm.nih.gov/34724806/↩
Keys, A., Atherosclerosis: a problem in newer public health, Journal of the Mount Sinai Hospital, New York, 1953. https://pubmed.ncbi.nlm.nih.gov/13085148/↩
Yerushalmy, J. and H.E. Hilleboe, Fat in the diet and mortality from heart disease; a methodologic note, New York State Journal of Medicine, 1957. https://pubmed.ncbi.nlm.nih.gov/13441073/↩
Siri-Tarino, P.W., Sun, Q., Hu, F.B., and Krauss, R.M., Meta-analysis of prospective cohort studies evaluating the association of saturated fat with cardiovascular disease, American Journal of Clinical Nutrition, 2010. https://pubmed.ncbi.nlm.nih.gov/20071648/↩
Grasgruber, P., et al., Food consumption and the actual statistics of cardiovascular diseases: an epidemiological comparison of 42 European countries, Food & Nutrition Research, 2016. https://pmc.ncbi.nlm.nih.gov/articles/PMC5040825/↩
Appleby, P.N., Crowe, F.L., Bradbury, K.E., Travis, R.C., and Key, T.J., Mortality in vegetarians and comparable nonvegetarians in the United Kingdom, American Journal of Clinical Nutrition, 2016. https://pmc.ncbi.nlm.nih.gov/articles/PMC4691673/↩
Dehghan, M., et al., Associations of fats and carbohydrate intake with cardiovascular disease and mortality in 18 countries from five continents (PURE), 2017. https://doi.org/10.1016/S0140-6736(17)32252-3↩
Dehghan, M., et al., Association of dairy intake with cardiovascular disease and mortality in 21 countries from five continents (PURE), 2018. https://doi.org/10.1016/S0140-6736(18)31812-9↩
Forouhi, N.G., et al., Differences in the prospective association between individual plasma phospholipid saturated fatty acids and incident type 2 diabetes: the EPIC-InterAct case-cohort study, Lancet Diabetes & Endocrinology, 2014. https://pubmed.ncbi.nlm.nih.gov/25107467/↩
Archer, E., Pavela, G., and Lavie, C.J., The Inadmissibility of What We Eat in America and NHANES Dietary Data in Nutrition and Obesity Research and the Scientific Formulation of National Dietary Guidelines, Mayo Clinic Proceedings, 2015. https://pmc.ncbi.nlm.nih.gov/articles/PMC4527547/; Ioannidis, J.P.A., The challenge of reforming nutritional epidemiologic research, JAMA, 2018. https://doi.org/10.1001/jama.2018.11025↩
Ornish, D., et al., Can lifestyle changes reverse coronary heart disease? The Lifestyle Heart Trial, The Lancet, 1990. https://pubmed.ncbi.nlm.nih.gov/1973470/↩
Howard, B.V., et al., Low-fat dietary pattern and risk of cardiovascular disease: the Women's Health Initiative Randomized Controlled Dietary Modification Trial, JAMA, 2006. https://pubmed.ncbi.nlm.nih.gov/16467234/↩
Prentice, R.L., et al., Low-fat dietary pattern and risk of invasive breast cancer: the Women's Health Initiative Randomized Controlled Dietary Modification Trial, JAMA, 2006. https://pubmed.ncbi.nlm.nih.gov/16467232/↩
Beresford, S.A., et al., Low-fat dietary pattern and risk of colorectal cancer: the Women's Health Initiative Randomized Controlled Dietary Modification Trial, JAMA, 2006. https://pubmed.ncbi.nlm.nih.gov/16467233/↩
Ramsden, C.E., et al., Re-evaluation of the traditional diet-heart hypothesis: analysis of recovered data from Minnesota Coronary Experiment (1968-73), BMJ, 2016. https://www.bmj.com/content/353/bmj.i1246↩
Ramsden, C.E., et al., Use of dietary linoleic acid for secondary prevention of coronary heart disease and death: evaluation of recovered data from the Sydney Diet Heart Study and updated meta-analysis, BMJ, 2013. https://www.bmj.com/content/346/bmj.e8707↩
Hooper, L., et al., Reduction in saturated fat intake for cardiovascular disease, Cochrane Database of Systematic Reviews, 2020. https://pmc.ncbi.nlm.nih.gov/articles/PMC7388853/↩
Aramburu, A., et al., Effect of reducing saturated fat intake on cardiovascular disease in adults: an umbrella review, Frontiers in Public Health, 2024. https://www.frontiersin.org/journals/public-health/articles/10.3389/fpubh.2024.1396576/full↩
Yamada, T., et al., Effects of saturated-fat restriction on cardiovascular outcomes in randomized controlled trials: a systematic review and meta-analysis, JMA Journal, 2025. https://pmc.ncbi.nlm.nih.gov/articles/PMC12095860/↩
Mensink, R.P., et al., Effects of dietary fatty acids and carbohydrates on the ratio of serum total to HDL cholesterol and on serum lipids and apolipoproteins: a meta-analysis of 60 controlled trials, American Journal of Clinical Nutrition, 2003. https://pubmed.ncbi.nlm.nih.gov/12716665/↩
Jakobsen, M.U., et al., Major types of dietary fat and risk of coronary heart disease: a pooled analysis of 11 cohort studies, American Journal of Clinical Nutrition, 2009. https://pubmed.ncbi.nlm.nih.gov/19211817/↩
Li, Y., et al., Saturated fats compared with unsaturated fats and sources of carbohydrates in relation to risk of coronary heart disease, Journal of the American College of Cardiology, 2015. https://pubmed.ncbi.nlm.nih.gov/26429077/↩
de Souza, R.J., et al., Intake of saturated and trans unsaturated fatty acids and risk of all cause mortality, cardiovascular disease, and type 2 diabetes, BMJ, 2015. https://www.bmj.com/content/351/bmj.h3978↩
Wang, D.D., et al., Association of Specific Dietary Fats With Total and Cause-Specific Mortality, JAMA Internal Medicine, 2016. https://pubmed.ncbi.nlm.nih.gov/27379574/↩
Creighton, B.C., et al., Paradox of hypercholesterolaemia in highly trained, keto-adapted athletes, BMJ Open Sport & Exercise Medicine, 2018. https://bmjopensem.bmj.com/content/4/1/e000429↩
Patikorn, C., et al., Effects of ketogenic diet on health outcomes: an umbrella review of meta-analyses of randomized clinical trials, BMC Medicine, 2023. https://pmc.ncbi.nlm.nih.gov/articles/PMC10210275/↩
Feng, S., et al., Effects of carbohydrate-restricted diets and macronutrient replacements on cardiovascular health and body composition in adults: a meta-analysis of randomized trials, American Journal of Clinical Nutrition, 2025. https://pmc.ncbi.nlm.nih.gov/articles/PMC12799388/↩
Phinney, S.D., et al., The transient hypercholesterolemia of major weight loss, American Journal of Clinical Nutrition, 1991. https://pubmed.ncbi.nlm.nih.gov/2035468/↩
Sniderman, A.D., et al., Physiological Bases for the Superiority of Apolipoprotein B Over Low-Density Lipoprotein Cholesterol and Non-High-Density Lipoprotein Cholesterol as a Marker of Cardiovascular Risk, Journal of the American Heart Association, 2022. https://doi.org/10.1161/JAHA.122.025858↩
Marston, N.A., et al., Association of Apolipoprotein B-Containing Lipoproteins and Risk of Myocardial Infarction in Individuals With and Without Atherosclerosis: Distinguishing Between Particle Concentration, Type, and Content, JAMA Cardiology, 2022. https://pubmed.ncbi.nlm.nih.gov/34773460/↩
Ference, B.A., et al., Low-density lipoproteins cause atherosclerotic cardiovascular disease. 1. Evidence from genetic, epidemiologic, and clinical studies, European Heart Journal, 2017. https://pubmed.ncbi.nlm.nih.gov/28444290/↩
Fernandez-Friera, L., et al., Normal LDL-Cholesterol Levels Are Associated With Subclinical Atherosclerosis in the Absence of Risk Factors, Journal of the American College of Cardiology, 2017. https://pubmed.ncbi.nlm.nih.gov/29241485/↩
Kawamoto, R., et al., Low density lipoprotein cholesterol and all-cause mortality rate: findings from a study on Japanese community-dwelling persons, Lipids in Health and Disease, 2021. https://doi.org/10.1186/s12944-021-01533-6↩
Penson, P.E., et al., Associations between very low concentrations of low density lipoprotein cholesterol, high sensitivity C-reactive protein, and health outcomes in the REGARDS study, European Heart Journal, 2018. https://pubmed.ncbi.nlm.nih.gov/30165636/↩
Willeit, P., et al., Low-Density Lipoprotein Cholesterol Corrected for Lipoprotein(a) Cholesterol, Risk Thresholds, and Cardiovascular Events, Journal of the American Heart Association, 2020. https://doi.org/10.1161/JAHA.119.016318↩
Budoff, M., Manubolu, V.S., Kinninger, A., Norwitz, N.G., et al., Carbohydrate Restriction-Induced Elevations in LDL-Cholesterol and Atherosclerosis: The KETO Trial, JACC: Advances, 2024. https://pmc.ncbi.nlm.nih.gov/articles/PMC11450898/↩
McKenzie, A.L., Athinarayanan, S.J., Van Tieghem, M.R., Volk, B.M., Roberts, C.G.P., Adams, R.N., Volek, J.S., Phinney, S.D., and Hallberg, S.J., 5-Year effects of a novel continuous remote care model with carbohydrate-restricted nutrition therapy including nutritional ketosis in type 2 diabetes: An extension study, Diabetes Research and Clinical Practice, 2024. https://pubmed.ncbi.nlm.nih.gov/39433217/↩
Lescinsky, H., et al., Health effects associated with consumption of unprocessed red meat: a Burden of Proof study, Nature Medicine, 2022. https://pmc.ncbi.nlm.nih.gov/articles/PMC9556326/↩
Glenn, A.J., et al., Concerns about the Burden of Proof studies, Nature Medicine, 2023. https://doi.org/10.1038/s41591-023-02294-8↩
Haile, D., et al., Health effects associated with consumption of processed meat, sugar-sweetened beverages and trans fatty acids: a Burden of Proof study, Nature Medicine, 2025. https://doi.org/10.1038/s41591-025-03775-8↩
Johnston, B.C., et al., Unprocessed Red Meat and Processed Meat Consumption: Dietary Guideline Recommendations From the Nutritional Recommendations (NutriRECS) Consortium, Annals of Internal Medicine, 2019. https://www.acpjournals.org/doi/10.7326/M19-1621↩
Shi, W., et al., Red meat consumption, cardiovascular diseases, and diabetes: a systematic review and meta-analysis, European Heart Journal, 2023. https://pubmed.ncbi.nlm.nih.gov/37264855/↩
Li, C., Forouhi, N.G., et al., Meat consumption and incident type 2 diabetes: an individual-participant federated meta-analysis of 1.97 million adults with 100,000 incident cases from 31 cohorts in 20 countries, The Lancet Diabetes & Endocrinology, 2024. https://doi.org/10.1016/S2213-8587(24)00179-7↩
O'Connor, L.E., Hill, E.R., Wang, D.D., Clark, C.M., McGowan, B.S., Forman, M.R., and Campbell, W.W., Red and processed meat intakes and cardiovascular disease and type 2 diabetes mellitus: an umbrella systematic review and assessment of causal relations using Bradford Hill's criteria, Critical Reviews in Food Science and Nutrition, 2022. https://doi.org/10.1080/10408398.2022.2123778↩
Zhang, C., et al., Red and processed meat consumption and non-cancer-related outcomes in humans: an umbrella review, British Journal of Nutrition, 2023. https://doi.org/10.1017/S0007114522003415↩
Iqbal, R., et al., Associations of unprocessed and processed meat intake with mortality and cardiovascular disease in 21 countries, American Journal of Clinical Nutrition, 2021. https://doi.org/10.1093/ajcn/nqaa448↩
Pan, A., et al., Red meat consumption and mortality: results from 2 prospective cohort studies, Archives of Internal Medicine, 2012. https://pubmed.ncbi.nlm.nih.gov/22412075/↩
Zhong, V.W., et al., Associations of Processed Meat, Unprocessed Red Meat, Poultry, or Fish Intake With Incident Cardiovascular Disease and All-Cause Mortality, JAMA Internal Medicine, 2020. https://pubmed.ncbi.nlm.nih.gov/32011623/↩
Lee, J.E., et al., Meat intake and cause-specific mortality: a pooled analysis of Asian prospective cohort studies, American Journal of Clinical Nutrition, 2013. https://doi.org/10.3945/ajcn.113.062638; Grasgruber, P., et al., Food consumption and the actual statistics of cardiovascular diseases, Food & Nutrition Research, 2016. https://pmc.ncbi.nlm.nih.gov/articles/PMC5040825/; Park, K., et al., Unprocessed Meat Consumption and Incident Cardiovascular Diseases in Korean Adults, Nutrients, 2017. https://pmc.ncbi.nlm.nih.gov/articles/PMC5452228/↩
Wang, P., Zhang, Y., and Giovannucci, E.L., Dietary context in the association between red meat consumption and risk of type 2 diabetes, Metabolism, 2025. https://doi.org/10.1016/j.metabol.2025.156277↩
Neuenschwander, M., et al., Substitution of animal-based with plant-based foods on cardiometabolic health and all-cause mortality, BMC Medicine, 2023. https://doi.org/10.1186/s12916-023-03093-1↩
Guasch-Ferre, M., et al., Meta-analysis of randomized controlled trials of red meat consumption in comparison with various comparison diets on cardiovascular risk factors, Circulation, 2019. https://doi.org/10.1161/CIRCULATIONAHA.118.035225↩
Bergeron, N., et al., Effects of red meat, white meat, and nonmeat protein sources on atherogenic lipoprotein measures in the context of low compared with high saturated fat intake: a randomized controlled trial, American Journal of Clinical Nutrition, 2019. https://pubmed.ncbi.nlm.nih.gov/31161217/↩
Wang, Z., et al., Impact of chronic dietary red meat, white meat, or non-meat protein on trimethylamine N-oxide metabolism and renal excretion in healthy men and women, European Heart Journal, 2019. https://pubmed.ncbi.nlm.nih.gov/30535398/↩
IARC, Red Meat and Processed Meat, IARC Monographs Volume 114, 2018. https://publications.iarc.who.int/Book-And-Report-Series/Iarc-Monographs-On-The-Identification-Of-Carcinogenic-Hazards-To-Humans/Red-Meat-And-Processed-Meat-2018↩
Bouvard, V., et al., Carcinogenicity of consumption of red and processed meat, The Lancet Oncology, 2015. https://doi.org/10.1016/S1470-2045(15)00444-1↩
World Cancer Research Fund/American Institute for Cancer Research, Diet, Nutrition, Physical Activity and Colorectal Cancer, Continuous Update Project Third Expert Report (revised 2018). https://www.wcrf.org/wp-content/uploads/2024/10/Colorectal-cancer-report.pdf↩
Ungvari, Z., et al., Association between red and processed meat consumption and colorectal cancer risk: a comprehensive meta-analysis of prospective studies, GeroScience, 2025. https://pmc.ncbi.nlm.nih.gov/articles/PMC12181564/↩
Singh, P.N. and G.E. Fraser, Dietary Risk Factors for Colon Cancer in a Low-risk Population, American Journal of Epidemiology, 1998. https://doi.org/10.1093/oxfordjournals.aje.a009697↩
Feng, Q., et al., Raw and Cooked Vegetable Consumption and Risk of Cardiovascular Disease: A Study of 400,000 Adults in UK Biobank, Frontiers in Nutrition, 2022. https://www.frontiersin.org/articles/10.3389/fnut.2022.831470↩
Clark, M. and D. Tilman, Comparative analysis of environmental impacts of agricultural production systems, agricultural input efficiency, and food choice, 2017. https://iopscience.iop.org/article/10.1088/1748-9326/aa6cd5; Poore, J. and T. Nemecek, Reducing food's environmental impacts through producers and consumers, 2018. https://pubmed.ncbi.nlm.nih.gov/29853680/↩
Xu, X., et al., Global greenhouse gas emissions from animal-based foods are twice those of plant-based foods, Nature Food, 2021. https://www.nature.com/articles/s43016-021-00358-x↩
FAO, Pathways towards lower emissions: a global assessment of the greenhouse gas emissions and mitigation options from livestock agrifood systems, 2023. https://www.fao.org/documents/card/en/c/cc9029en↩
McAuliffe, G.A., et al., Protein quality as a complementary functional unit in life cycle assessment (LCA), 2023. https://doi.org/10.1007/s11367-022-02123-z↩
Tukiainen, K., et al., Protein quality and multi-nutrient functional units in life-cycle assessment, International Journal of Life Cycle Assessment, 2025. https://doi.org/10.1007/s11367-025-02451-w↩
IPCC, Climate Change 2022: Mitigation of Climate Change, Working Group III, Chapter 2 supplementary material on emission metrics. https://www.ipcc.ch/report/ar6/wg3/downloads/report/IPCC_AR6_WGIII_Chapter_02_SupplementaryMaterial.pdf↩
Allen, M.R., et al., A solution to the misrepresentations of CO2-equivalent emissions of short-lived climate pollutants under ambitious mitigation, npj Climate and Atmospheric Science, 2018. https://www.nature.com/articles/s41612-018-0026-8↩
Cain, M., et al., Improved calculation of warming-equivalent emissions for short-lived climate pollutants, npj Climate and Atmospheric Science, 2019. https://www.nature.com/articles/s41612-019-0086-4↩
Meinshausen, M. and Nicholls, Z., GWP* is a model, not a metric, Environmental Research Letters, 2022. https://doi.org/10.1088/1748-9326/ac5930↩
Rogelj, J. and Schleussner, C.-F., Unintentional unfairness when applying new greenhouse gas emissions metrics at country level, Environmental Research Letters, 2019. https://doi.org/10.1088/1748-9326/ab4928↩
IPCC, Climate Change 2022: Mitigation of Climate Change, Working Group III, Chapter 7: Agriculture, Forestry and Other Land Uses. https://www.ipcc.ch/report/ar6/wg3/chapter/chapter-7/↩
European Environment Agency, Greenhouse gas emissions from agriculture, 2025. https://www.eea.europa.eu/en/analysis/indicators/greenhouse-gas-emissions-from-agriculture↩
De Laurentiis, V., Maier, S., Horn, R., et al., Soil organic carbon as an indicator of land use impacts in life cycle assessment, The International Journal of Life Cycle Assessment, 2024. https://doi.org/10.1007/s11367-024-02307-9↩
Godde, C.M., et al., Soil carbon sequestration in grazing systems: managing expectations, Climatic Change, 2020. https://doi.org/10.1007/s10584-020-02673-x↩
Garnett, T., et al., Grazed and Confused? Ruminating on cattle, grazing systems, methane, nitrous oxide, the soil carbon sequestration question, 2017. https://www.oxfordmartin.ox.ac.uk/publications/grazed-and-confused↩
Henry, B., et al., Soil carbon sequestration in rangelands: a critical review of the impacts of major management strategies, The Rangeland Journal, 2024. https://www.publish.csiro.au/RJ/fulltext/RJ24005↩
Wang, Y., et al., Risk to rely on soil carbon sequestration to offset global ruminant emissions, Nature Communications, 2023. https://www.nature.com/articles/s41467-023-43452-3↩
Hayek, M.N., Harwatt, H., Ripple, W.J., and Mueller, N.D., The carbon opportunity cost of animal-sourced food production on land, Nature Sustainability, 2021. https://www.nature.com/articles/s41893-020-00603-4↩
Santo, R. and Cho, C., Despite "Carbon Neutral" Certifications, Beef Emissions Can Be Lower, but Never Low (formerly Does Low-Emissions Beef Exist?), World Resources Institute, 2026. https://www.wri.org/insights/truth-about-low-emissions-beef↩